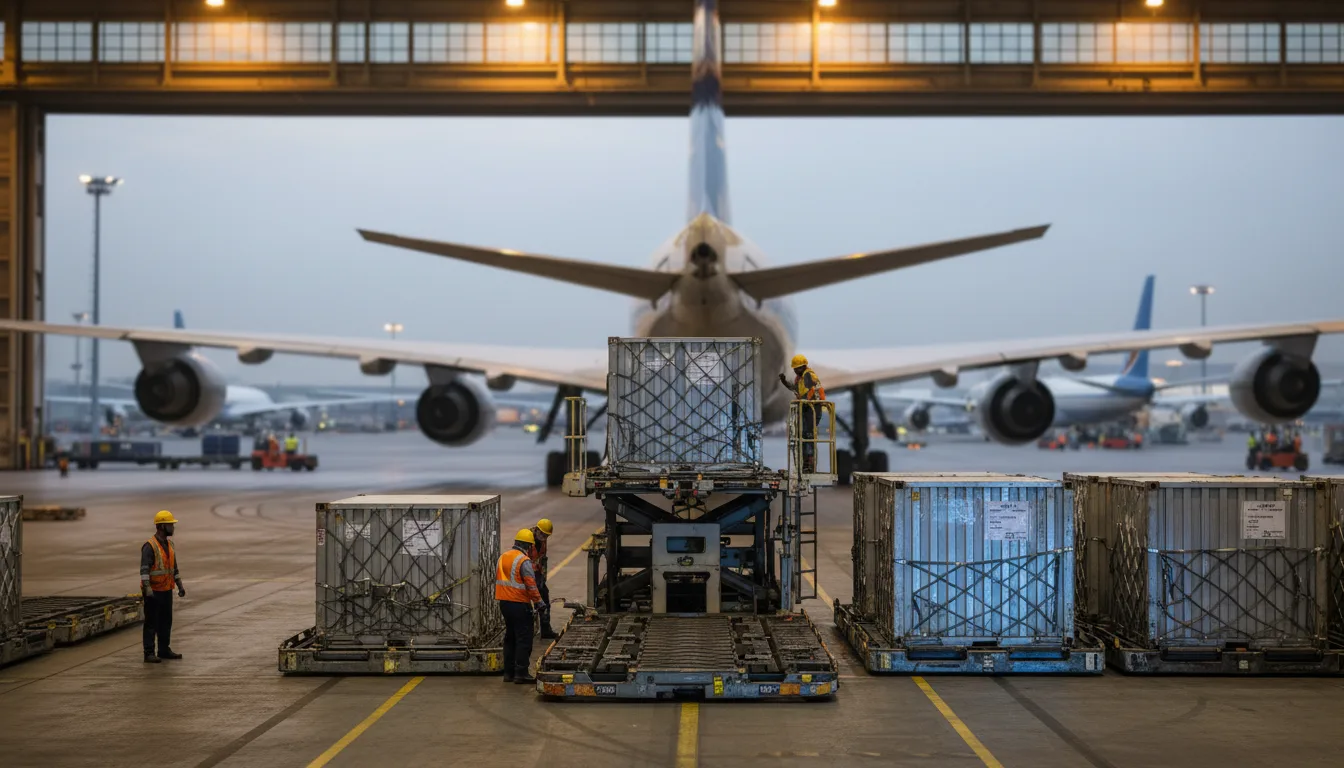
Air cargo had a strong May. Global cargo tonne-kilometres (CTK) rose 6.0% year-on-year, with international operations outperforming at 6.5%. That is well ahead of capacity growth, which came in at just 1.9%. The gap between demand and capacity is tightening the market in most regions. Carriers are filling more aircraft, and yield growth is helping to absorb fuel costs that remain extremely elevated.
The headline number masks sharp divergence by region. Africa posted 13.3% CTK growth. North America hit 10.5%. The Middle East contracted 8.9%. Conflict-related is reshaping Gulf trade corridors in real time. For freight forwarders routing cargo through or around the region, that is not theoretical. It is affecting schedules, capacity, and pricing right now. Based on reporting from IATA, this data covers May 2026 performance across IATA’s member airlines, representing roughly 85% of global air traffic.

Markets move fast. Your quoting should too.
See live rates, compare options and manage shipments in one workflow.
Regional Performance: Africa and North America Lead, Middle East Contracts
Africa recorded the strongest regional growth in May 2026 at 13.3% year-on-year. Capacity grew only 1.3%, pushing the cargo load factor (CLF) to 46.9%. The Africa-Asia trade lane grew 14.1% year-on-year across 11 consecutive months of growth. Africa holds just 2.1% of global market share, but the trajectory is clearly upward.
North American carriers posted 10.5% CTK growth with capacity up 2.4% and a CLF of 41.0%. The Asia-North America trade lane drove much of that performance, up 19.9% year-on-year across four consecutive months of growth. With a 23.5% market share, Asia-North America is the highest-share trade lane in the IATA data and the fastest-growing major lane in May 2026.
The Middle East is the outlier. Carriers in the region saw demand fall 8.9% and capacity contract 9.2%. CLF sits at 46.5% on a 13.2% global market share. The Europe-Middle East trade lane dropped 19.8% year-on-year over three consecutive months of contraction. The Middle East-Asia lane fell 16.5% year-on-year over the same period. War-related impacts on Gulf-linked corridors are the driver. This is not a demand story; it is a story.
Asia-Pacific and Europe Deliver Solid Above-Trend Growth
Asia-Pacific carriers grew CTK by 8.0% year-on-year in May 2026. Capacity rose 5.1%, the highest capacity growth of any region. The CLF reached 47.7% on a 35.8% global market share, making this the largest regional bloc by volume. The Europe-Asia trade lane grew 10.0% year-on-year across 39 consecutive months of growth, and the Within Asia lane added 5.5% across 31 consecutive months. These are durable, structural growth numbers.
European carriers posted 6.7% CTK growth with capacity up 2.2%. Europe holds a 21.4% global market share and leads all regions on CLF at 53.9%. That is a meaningful efficiency signal. European carriers are running tighter operations, squeezing more revenue per available tonne-kilometre. The Within Europe lane grew 11.5% year-on-year across four consecutive months.
Latin America and the Caribbean grew CTK by just 1.9%, the weakest positive performance outside the Middle East. Capacity grew faster at 5.6%, which pushed the CLF down to 34.8%. With a 2.9% global market share, the region remains small but carries oversupply pressure. Forwarders working this region should watch capacity carefully. More space does not always mean better rates if demand growth continues to lag.
Macro Conditions: Trade Growing, Manufacturing Strong, Export Orders Soft
Global trade grew 5.0% year-on-year in May 2026, marking 25 consecutive months of annual growth. That is a long, consistent run. It supports air cargo demand directly, particularly on time-sensitive lanes where e-commerce and high-value manufacturing drive volumes. The Global Manufacturing Output PMI reached 53.5, firmly in expansion territory.
The one note of caution is the New Export Orders Index at 49.6. That sits below the 50-mark, meaning new export orders are technically contracting. It is a forward-looking indicator. If it persists below 50, demand growth could moderate in the months ahead. For now it is a flag, not a trend, but freight professionals should watch it.
IATA Director General Willie Walsh acknowledged the mixed picture directly, noting cautious optimism for air cargo’s prospects while recognising the ongoing drag from Middle East uncertainties.
“Air cargo demand grew 6% year-on-year in May, with Africa, Asia-Pacific, Europe, and North American regions all reporting above trend growth. Carriers in the Middle East, however, reported a combined contraction of 8.9% year-on-year as war-related impacts continued. May’s strong performance coupled with macro-economic factors give cautious optimism for air cargo’s prospects over the remainder of the year. Trade and manufacturing output are both growing. Airlines have adapted operations to align with shifting demand patterns and supply chain needs. Meanwhile, yield growth and higher load factors are helping to recoup higher fuel costs. It’s still a tough year, particularly as Middle East uncertainties weigh heavily on parts of the industry, but demand and airline resilience are clear.” Willie Walsh, IATA Director General
Fuel Costs and Load Factors: Airlines Absorbing the Pressure
Jet fuel prices fell 16.3% month-on-month in May 2026. That sounds dramatic, but context matters. Fuel costs still sat 93.5% above year-earlier levels. A month-on-month drop from a very high base is welcome relief, not a structural shift. Airlines are not out of the fuel cost woods yet.
The offset is coming through yield growth and higher load factors. The overall CLF reached 46.3% globally. Where demand outpaces capacity, load factors rise and yield follows. That dynamic is visible in Europe at 53.9% CLF and in Asia-Pacific at 47.7%. Higher utilisation protects margin even when fuel is expensive.
Capacity discipline is playing a role too. International ACTK grew only 2.8% against international CTK growth of 6.5%. Airlines are not flooding the market with new capacity. That restraint is deliberate. It keeps load factors elevated and gives carriers pricing on lanes where demand is strong.

CSN Perspective: What May 2026 Means for Independent Forwarders
The Asia-North America lane at 19.9% growth is the standout number for forwarders right now. It holds 23.5% of global market share and has grown for four consecutive months. Forwarders not actively quoting this lane are missing a significant volume opportunity. The Europe-Asia lane at 10.0% growth across 39 consecutive months is the most consistent performer in the market. These are not short-term spikes. They are sustained trade flows that reward forwarders with reliable access to capacity on both corridors. CSN provides freight professionals direct access to competitive rates across key global lanes – no platform tax, no lock-in, built for the way forwarders actually work.
The Middle East situation demands active route planning. The Europe-Middle East lane is down 19.8% and the Middle East-Asia lane down 16.5%. Forwarders with cargo moving through Gulf hubs need alternative routing options ready. Relying on a single corridor in a contracting market is a risk. SME forwarders in particular need multi-carrier, multi-leg quoting tools to fast when lanes tighten or close. Speed to quote on alternative routing is a competitive advantage right now, not a nice-to-have.
SUBSCRIBE TO FAST FORWARDER
YOUR INDUSTRY INTELLIGENCE HUB
Fast Forwarder gives you weekly market insights, rate trends and industry intelligence.
*UNSUBSCRIBE ANYTIME. WE DON’T SEND SPAM.

Frequently Asked Questions
How much did global air cargo demand grow in May 2026?
Global air cargo demand grew 6.0% year-on-year in May 2026, measured in cargo tonne-kilometres (CTK). International operations grew slightly faster at 6.5%. Capacity grew just 1.9%, meaning the market tightened overall with load factors rising across most regions.
Which region performed best for air cargo in May 2026?
African carriers recorded the strongest regional growth at 13.3% year-on-year. North American carriers were second at 10.5%. Asia-Pacific posted 8.0% and Europe 6.7%. Latin America and the Caribbean grew 1.9%. The Middle East was the only region to contract, down 8.9%.
Why did Middle East air cargo demand fall in May 2026?
Middle Eastern carriers saw demand fall 8.9% and capacity contract 9.2% year-on-year in May 2026. IATA attributed this to war-related impacts affecting Gulf-linked trade corridors. Both the Europe-Middle East lane (down 19.8%) and the Middle East-Asia lane (down 16.5%) contracted sharply over three consecutive months.
What is the best-performing air cargo trade lane in May 2026?
Asia-North America is the top-performing lane, up 19.9% year-on-year across four consecutive months of growth. It holds a 23.5% global market share – the highest-share lane in the May 2026 IATA data – and is the fastest-growing major trade lane. Europe-Asia is the most consistent, with 10.0% growth across 39 consecutive months.
Are fuel costs improving for airlines in air cargo?
Jet fuel prices fell 16.3% month-on-month in May 2026, which provides some short-term relief. However, fuel costs remain 93.5% above year-earlier levels. Airlines are offsetting pressure through yield growth and tighter capacity management, with load factors rising as demand outpaces supply on key lanes.
Cargo Solutions Network (CSN) is the digital freight portal built by freight people, for freight people. Quote airport-to-airport (A2A) or door-to-door (D2D) across key global lanes. No platform tax. No lock-ins. Compare rates, book direct, track milestones and keep your clients informed in one place. The Asia-North America and Europe-Asia lanes are moving fast. Get on them. Join and quote today at cargosolutionsnetwork.com.